前言
监控是整个运维乃至整个产品生命周期中最重要的一环,事前及时预警发现故障,事后提供详实的数据用于追查定位问题。
使用Prometheus作为监控解决方案,主要基于以下原因:
- 云原生时代,2016 年 Prometheus 成为继 k8s 后,是第二名 CNCF(Cloud Native Computing Foundation) 成员。
- Kubeshpere自带,安装配置简单,只需要一个配置文件
- Prometheus自带的web界面很简洁,Grafana支持添加Prometheus作为数据源,配合后可以展示漂亮的监控大屏
大致流程:
- 被监控主机安装node_exporter,运行后暴露出一个供采集各个指标(如基本CPU,内存,磁盘容量,网络情况等)的http地址
- 安装AlertManager,配置告警通知策略,如定义了CPU,内存和硬盘三个规则,当触发CPU报警规则走SMTP邮箱,其余走webhook,slack,每一小时最多提醒一次
- 安装Prometheus,配置监控采集的具体信息,如采集频率,采集地址,当触发报警规则通知给AlertManager
- Grafana将数据可视化,更直观的查看被监控主机各个指标信息,包含直方图,曲线图图,饼图等,需要将数据源配置为Prometheus
环境
两台Linux主机
127.0.0.10 被监控主机,运行node_exporter
127.0.0.11 运行Prometheus,AlertManager,Grafana
测试时可以用自己的一台主机,自己监控自己..
Prometheus
首先介绍Prometheus,官方架构图
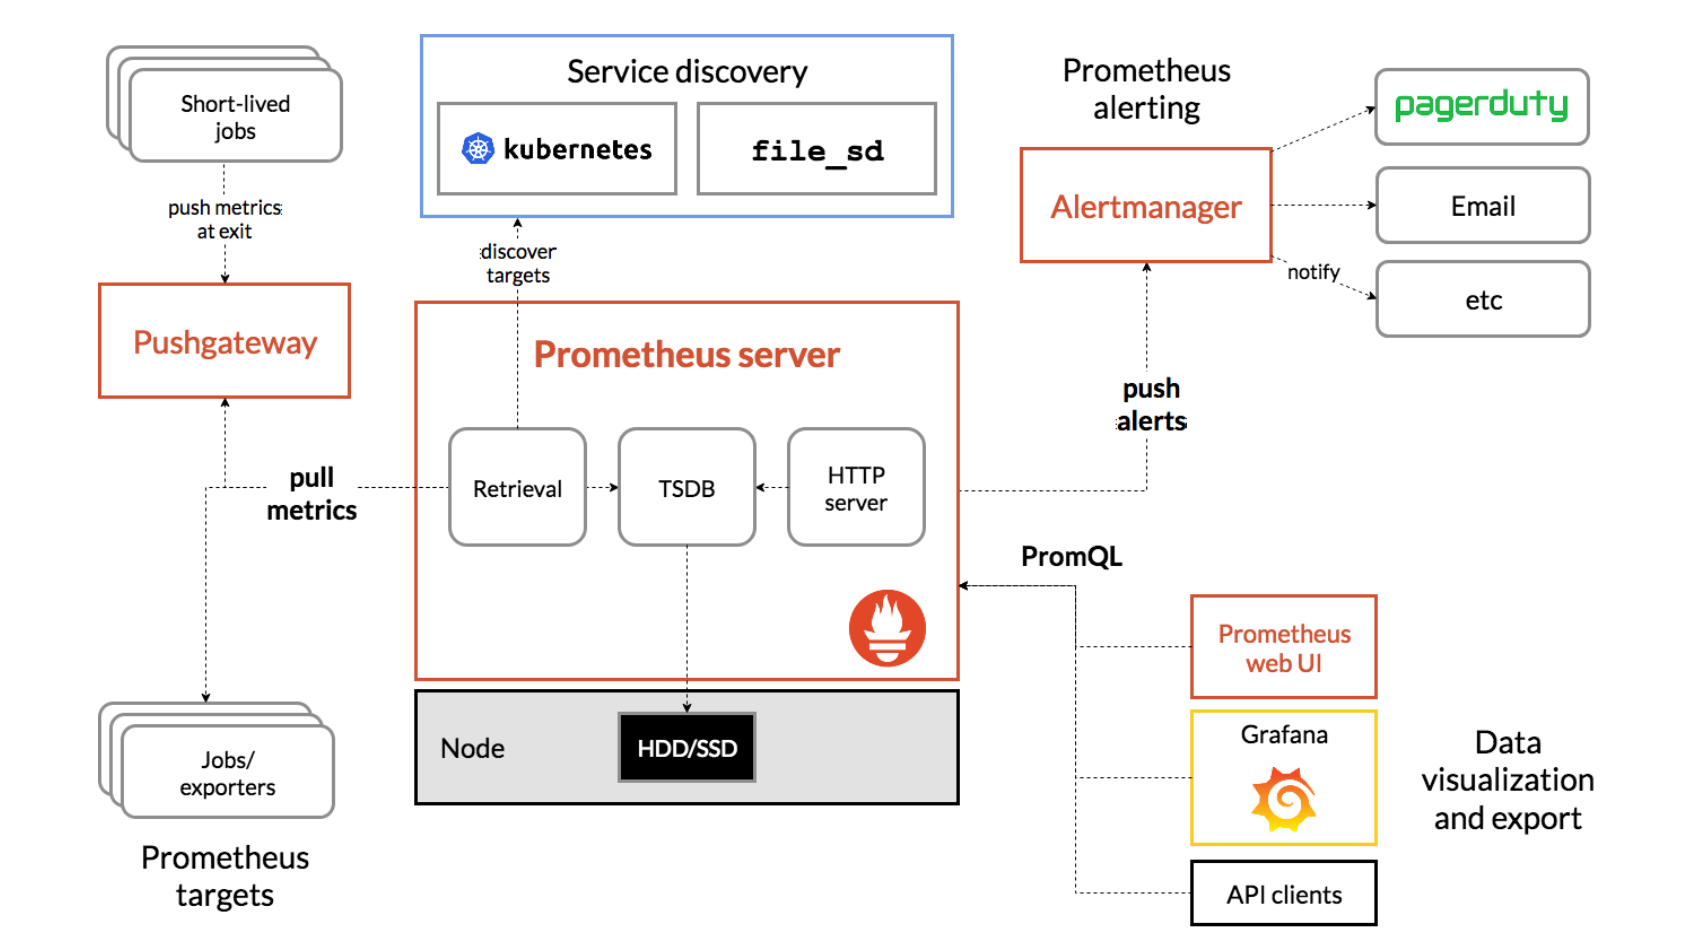
Prometheus的特点
● 多维度数据模型。
● 提供自己的灵活的查询语言。PromQL
● 不依赖分布式存储,单个服务器节点是自主的。
● 通过基于HTTP的pull方式采集时序数据。
● 可以通过中间网关进行时序列数据推送。
● 通过服务发现或者静态配置来发现目标服务对象。
● 支持多种多样的图表和界面展示,比如Grafana等。
Prometheus包含的功能模块:
● 内置了一个HTTP server,用来提供了Web界面
● TSDB:时序数据库,用来存储抓取到的数据,供查询和图表展示
● 采集程序,根据配置文件的目标地址去抓取指标
● PromQL:PromQL是Prometheus内置的数据查询语言,其提供对时间序列数据丰富的查询,聚合以及逻辑运算能力的支持
● Push Gateway: 默认情况下Prometheus是去目标pull拉数据,也可以让目标主动push推数据,这个不常用
● Service discovery: 服务发现,比如k8s集群有N台主机,IP地址和数量可能不是固定,我们可以让Prometheus自动发现集群中所有的节点,降低维护成本。
部署node_exporter到监测节点
node_exporter主要用来监控服务器的基础信息,如: cpu、内存、磁盘、网卡
类似的:
mysql_exporter: Prometheus 官方项目,可以采集mysql各项运行指标
blackbox_exporter: Prometheus 官方项目,网络探测,dns、ping、http监控
process-exporter: 采集进程指标
exporter有官方的和第三方的,也可以自己制作exporter
由于Prometheus+AlertManager+NodeExporter都是go语言开发的,编译完就是一个二进制文件,安装非常简单,直接放到系统环境目录即可,或者使用docker运行
https://hub.docker.com/r/prom/node-exporter
https://hub.docker.com/r/prom/prometheus
https://hub.docker.com/r/prom/alertmanager
由于我们要使用NodeExporter采集主机信息,这里直接安装到主机上面
wget https://github.com/prometheus/node_exporter/releases/download/v1.3.1/node_exporter-1.3.1.linux-amd64.tar.gz
tar -xzvf node_exporter-1.3.1.linux-amd64.tar.gz
mv node_exporter /usr/local/bin
做成系统服务
方便随系统启动
vi /etc/systemd/system/node_exporter.service
[Unit]
Description=node_exporter
Documentation=https://prometheus.io/
After=network.target
[Service]
Type=simple
User=ubuntu
ExecStart=/usr/local/bin/node_exporter --web.listen-address=":9100"
Restart=on-failure
[Install]
WantedBy=multi-user.target
systemctl enable node_exporter
systemctl start node_exporter浏览器打开 127.0.0.1:9100 就会看到各个指标信息的页面
列出一些CPU相关的
# HELP node_cpu_seconds_total Seconds the CPUs spent in each mode.
# #当前主机的CPU,0,1两核
# TYPE node_cpu_seconds_total counter
# CPU0 的 空闲CPU
node_cpu_seconds_total{cpu="0",mode="idle"} 2.28999034e+06
# #CPU0 的 io使用量
node_cpu_seconds_total{cpu="0",mode="iowait"} 15581.96
node_cpu_seconds_total{cpu="0",mode="irq"} 0
node_cpu_seconds_total{cpu="0",mode="nice"} 15.26
node_cpu_seconds_total{cpu="0",mode="softirq"} 7405.25
node_cpu_seconds_total{cpu="0",mode="steal"} 0
node_cpu_seconds_total{cpu="0",mode="system"} 566896.41
node_cpu_seconds_total{cpu="0",mode="user"} 1.22605032e+06
node_cpu_seconds_total{cpu="1",mode="idle"} 2.28415856e+06
node_cpu_seconds_total{cpu="1",mode="iowait"} 10769.86
node_cpu_seconds_total{cpu="1",mode="irq"} 0
node_cpu_seconds_total{cpu="1",mode="nice"} 17.36
node_cpu_seconds_total{cpu="1",mode="softirq"} 7074.85
node_cpu_seconds_total{cpu="1",mode="steal"} 0
node_cpu_seconds_total{cpu="1",mode="system"} 565591.15
node_cpu_seconds_total{cpu="1",mode="user"} 1.2386354e+06
......
如果node_exoporter跑在服务器,注意防火墙开放相关端口
部署alertManager
下载,安装和node_exporter一样,略过
新建alertmanager配置文件, alertmanaget.yaml
global:
  # 每一分钟检查一次是否恢复
  resolve_timeout: 1m
  smtp_from: 'yourname@qq.com''
  # The default hostname to identify to the SMTP server.
  smtp_hello: 'yourname@qq.com''
  smtp_smarthost: 'smtp.exmail.qq.com:465'
  smtp_auth_username: 'yourname@qq.com'
  smtp_auth_password: 'xxx'
  smtp_require_tls: false
# 所有报警信息进入后的根路由,用来设置报警的分发策略
route:
  # 进来的报警信息会带有标签,指定根据哪些标签进行分组
  group_by: [alertname]
  # 组告警等待时间。也就是告警产生后等待10s,如果有同组告警一起发出
  group_wait: 10s
  # 两组告警的间隔时间
  group_interval: 10s
  # 重复告警的间隔时间,减少相同告警的发送频率
  repeat_interval: 1h
  #设置默认接收人
  receiver: 'webhook'
  # 子路由, 用来覆盖配置
  routes:
  - receiver: webhook
    continue: true
    group_wait: 10s
    match:
      team: node
receivers:
- name: 'email'
  email_configs:
  - to: 'receiver@qq.com'
send_resolved: true运行时指定配置文件--config.file=/etc/alertmanager/alertmanager.yml
默认端口是9093
部署prometheus
下载,安装和node_exporter一样,略过
采集的数据只保留最近7天
–storage.tsdb.retention.time=7d
数据保存的目录
–storage.tsdb.path
[Unit]
Description=Prometheus
Documentation=https://prometheus.io/
After=network.target
[Service]
Type=simple
ExecStart=/usr/local/bin/prometheus --config.file="main.yaml" --storage.tsdb.retention.time=7d --web.enable-admin-api --web.enable-lifecycle
Restart=on-failure
[Install]
WantedBy=multi-user.target
设置开机自启,并检查服务开启状态
sudo systemctl enable prometheus
sudo systemctl start prometheus
sudo systemctl status prometheus
Prometheus运行前,我们要提前写好规则,当规则满足,我们可以触发报警,Alertmanager就是专门处理各种报警的,支持如email,webhook,slack等提醒
新建 rules/cpu_over.yml, 注意expr,就是上述提到的PromQL
groups:
- name: CPU报警规则
  rules:
  - alert: CPU使用率告警 # 警告名
    # 触发规则
    expr: 100 - (avg by(instance) (irate(node_cpu_seconds_total{mode="idle"}[1m]))) * 100 > 80
    # 规则触发持续多长时间发送告警
    for: 30m
    # 告警附加标签
    labels:
      severity: warning
    # 告警附加注释
    annotations:
      summary: "CPU使用率正在飙升。"
      description: "CPU使用率超过80%(当前值:{{ humanize $value }}%)"
关于main.yaml主配置文件
# my global config
global:
  scrape_interval: 15s #15s抓取一次目标指标,默认1分钟.
  evaluation_interval: 15s # 15是评估一次是否触发规则,默认1分钟.
  # scrape_timeout is set to the global default (10s).

# Alertmanager configuration
alerting:
  alertmanagers:
    - static_configs:
      - targets: ['127.0.0.11:9093']

# Load rules once and periodically evaluate them according to the global 'evaluation_interval'.

rule_files:
  - /etc/prometheus/rules/*.yml

# A scrape configuration containing exactly one endpoint to scrape:
# 这里表示抓取对象的配置
# Here it's Prometheus itself.
# 这里是抓取promethues自身的配置
scrape_configs:
  # The job name is added as a label `job=<job_name>` to any timeseries scraped from this config.
  # 这个配置是表示在这个配置内的时间序例,每一条都会自动添加上这个{job_name:"prometheus"}的标签。
  - job_name: "node1"
    scrape_interval: 15s
    static_configs:
      - targets: ["127.0.0.10:9100"]
Grafana 安装
我们用Docker安装 https://hub.docker.com/r/grafana/grafana
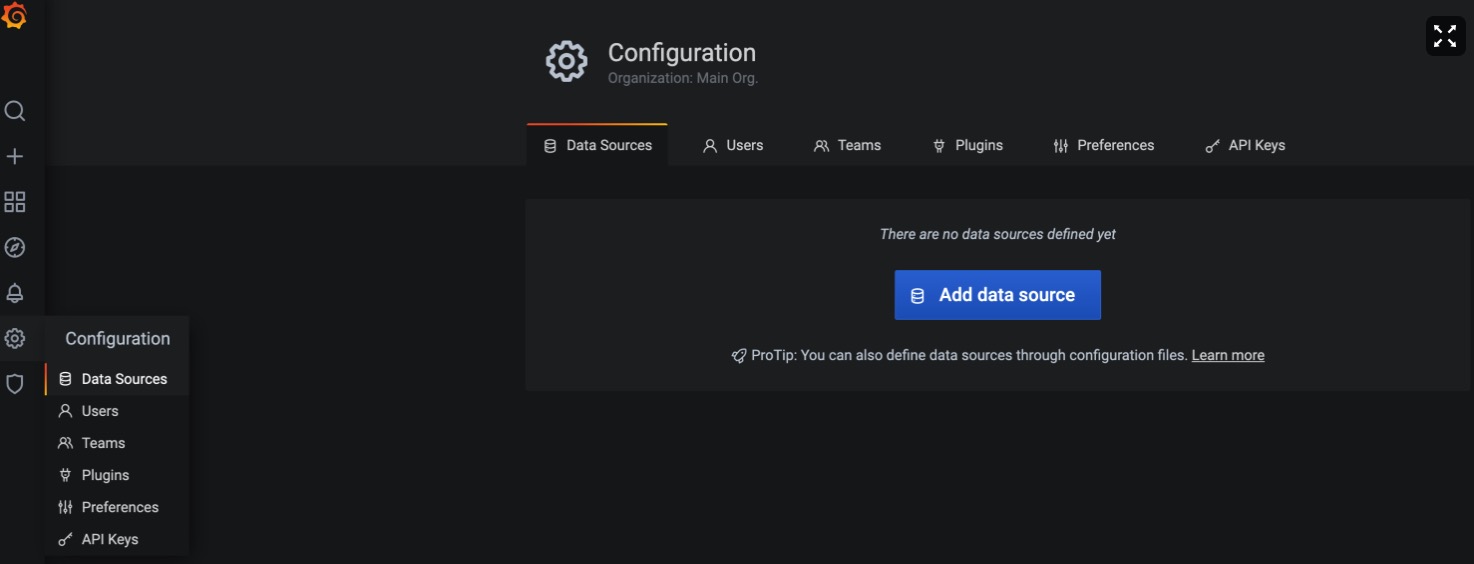
首先添加数据源

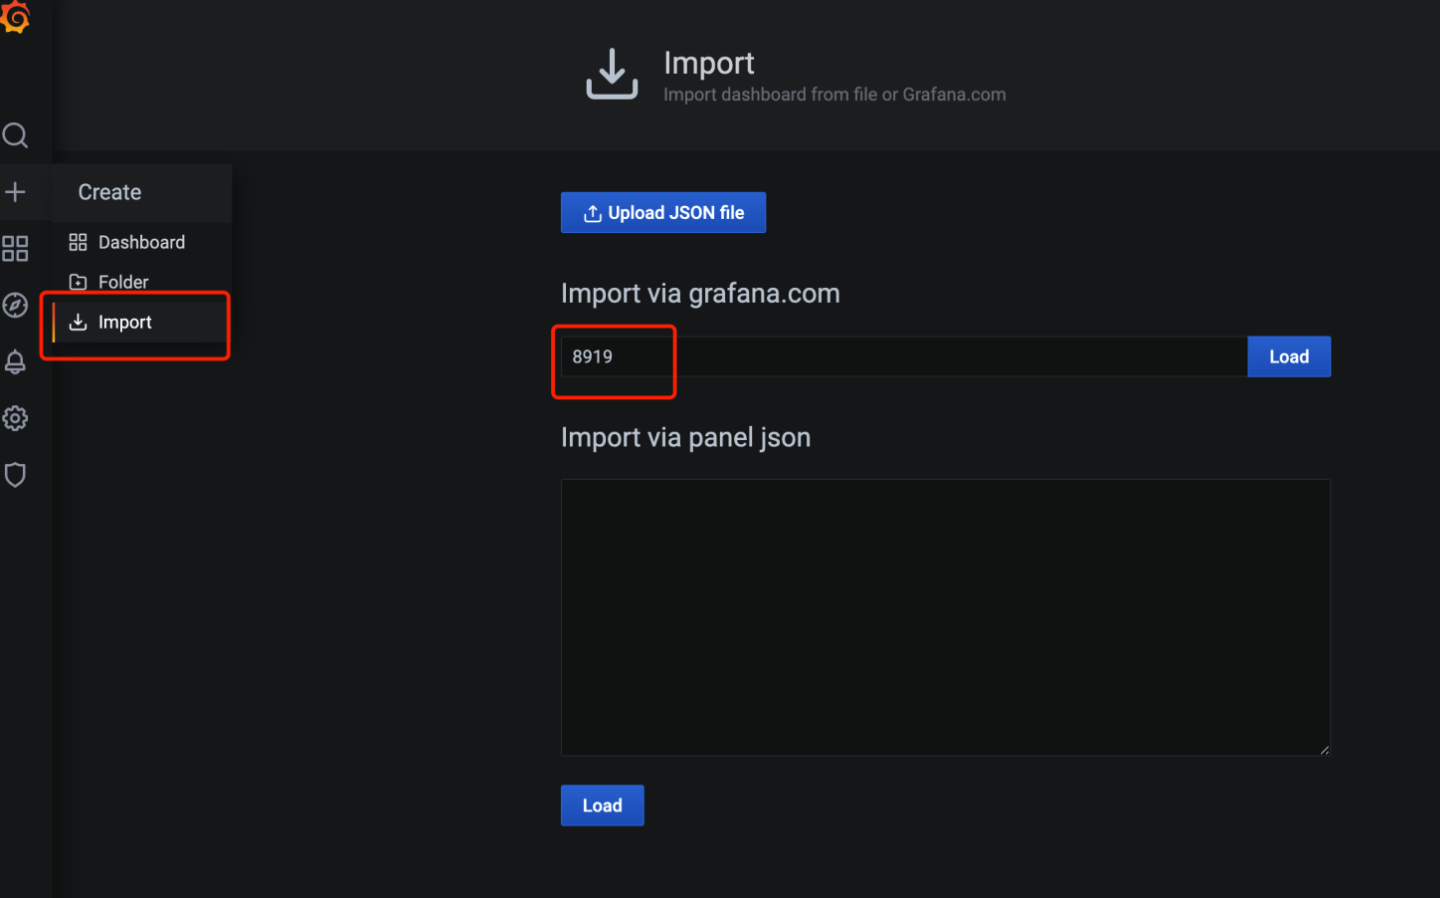
直接导入别人制作好的dashboard,所谓dashboard,由很多图表构成,每个图表由坐标轴,高宽和PromQL查询表达式等信息组成
https://grafana.com/grafana/dashboards/8919
https://grafana.com/api/dashboards/8919/revisions/24/download
最终效果如图

参考
https://songjiayang.gitbooks.io/prometheus/content/
https://www.yuque.com/mafeifan/qo2a9q/